Travel Fatigue Patterns and Scoring Variability in Away Contest Projections
Henrik Sullivan · Jul 21, 2026
Travel Fatigue Patterns and Scoring Variability in Away Contest Projections
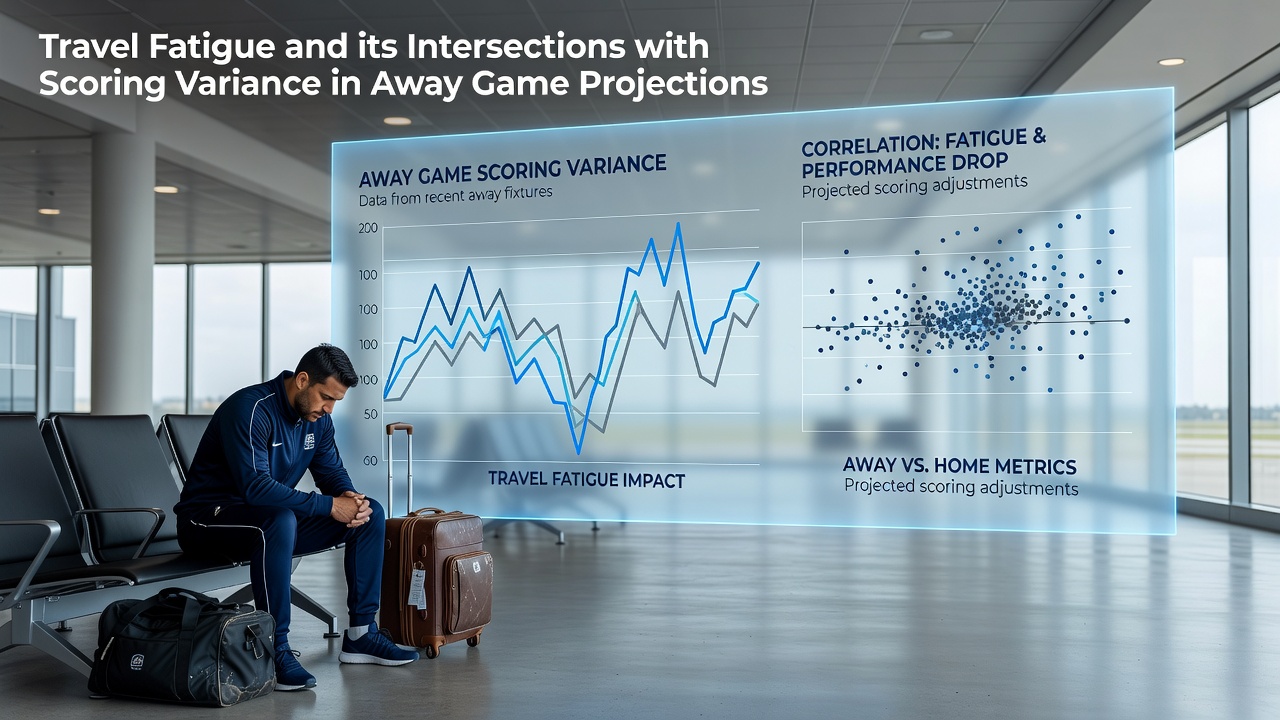
Travel fatigue emerges as a measurable factor in professional sports when teams cross multiple time zones or endure extended flights before competitions, and data from various leagues shows how these disruptions intersect with scoring outcomes in away settings. Researchers tracking performance metrics across basketball, football, and soccer have documented shifts in player output that alter expected point totals and increase variability in results, particularly when recovery windows shrink during condensed schedules.
Distance traveled correlates with changes in scoring margins according to analyses from league databases, where teams covering over 1,000 miles often post lower offensive efficiency ratings in the first half of games. Sleep cycle interruptions play a central role here, since circadian misalignment reduces reaction times and decision accuracy during critical moments, leading to wider spreads in final scores than models predict based solely on home records.
Key Factors Driving Travel Fatigue in Athletic Schedules
Multiple elements compound fatigue when teams prepare for away contests, including flight duration, altitude changes, and the timing of departures relative to competition starts. Studies compiled by sports science groups indicate that westward travel tends to produce more pronounced effects on scoring consistency than eastward journeys, because the body clock requires additional days to adjust fully after crossing several zones. Teams in leagues with frequent cross-country matchups experience these patterns repeatedly, and projections must account for cumulative load across back-to-back sequences.
Nutrition and hydration protocols during transit also factor into recovery timelines, as altered meal timing disrupts metabolic processes that support sustained energy output. Observers note that away squads arriving less than 48 hours before tip-off or kickoff show measurable dips in three-point shooting percentages or goal conversion rates compared with longer acclimation periods, which introduces greater variance into scoring forecasts used by analysts.
Intersections With Scoring Variance in Projection Models
Projection systems that incorporate travel data reveal elevated standard deviations in away game point totals, especially when distance exceeds regional boundaries or when multiple time zones separate venues. Figures from recent seasons demonstrate that away teams averaging fewer than 100 points in basketball contests following transcontinental flights, while variance spikes because individual player contributions fluctuate more widely than baseline expectations. This pattern extends to football, where total yardage outputs display similar spreads after long-haul trips.
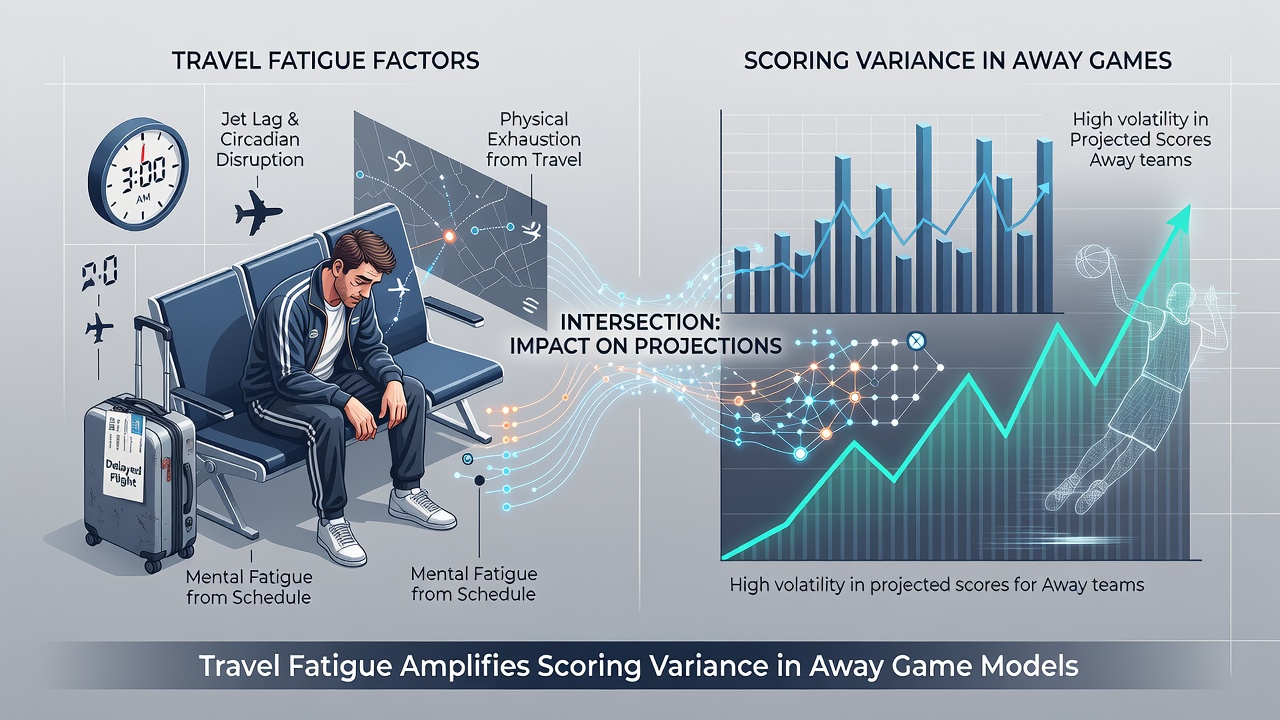
League-wide statistics highlight how these effects intensify during July periods when schedules overlap with international commitments or summer tournaments, forcing rapid transitions between continents. In 2026, early reports from international federations point to continued scheduling pressures that amplify fatigue signals in performance tracking, prompting model adjustments that weight recent travel history more heavily when generating away projections.
League-Specific Data and Recovery Windows
Basketball schedules produce some of the clearest intersections between travel and scoring variance because of dense calendars that limit rest days. Data indicates that teams on the second night of back-to-backs following flights post reduced field goal percentages, which widens the range of possible final margins and requires projection tools to build in additional uncertainty buffers. Soccer leagues present parallel findings, where goal tallies in away fixtures drop and fluctuate more after European or intercontinental travel segments.
Football contests show subtler but consistent trends, with rushing and passing efficiencies declining after extended road trips, according to aggregated play-by-play records. Recovery protocols vary by organization, yet evidence from performance labs suggests that even optimized sleep and nutrition strategies cannot fully offset the initial 24- to 72-hour window of adjustment, leaving room for variance in scoring outcomes that standard home-away splits overlook.
Adjustments in Analytical Approaches
Analysts refining projection models now integrate travel distance, time zone differential, and days since last game as weighted variables alongside traditional strength ratings. These additions narrow error margins in away scoring forecasts while acknowledging that variance remains higher than home equivalents regardless of adjustments. Research from institutions such as the Sports Science Institute supports including biometric recovery markers to refine these calculations further, particularly as wearable data becomes more accessible across teams.
Geographic patterns also surface in the data, with certain divisions or conferences experiencing more pronounced effects due to venue spacing. Canadian and Australian regulatory bodies overseeing sports integrity have referenced similar fatigue considerations in broader performance studies, underscoring the need for models that treat travel as a dynamic input rather than a static adjustment.
Conclusion
Travel fatigue continues to shape scoring variance in away game projections through documented physiological and logistical pathways that league data consistently captures. Models incorporating these variables deliver more accurate distributions of expected outcomes, while ongoing schedule analyses in 2026 highlight the persistent relevance of recovery timelines across major sports. Continued refinement of these intersections supports clearer assessments of away performance patterns without relying on unadjusted baselines.