Rest Cycles and Recovery Windows: How Downtime Shapes Thresholds in Multi-Game Athletic Forecasts
Drew Schmid · Jul 16, 2026
Rest Cycles and Recovery Windows: How Downtime Shapes Thresholds in Multi-Game Athletic Forecasts
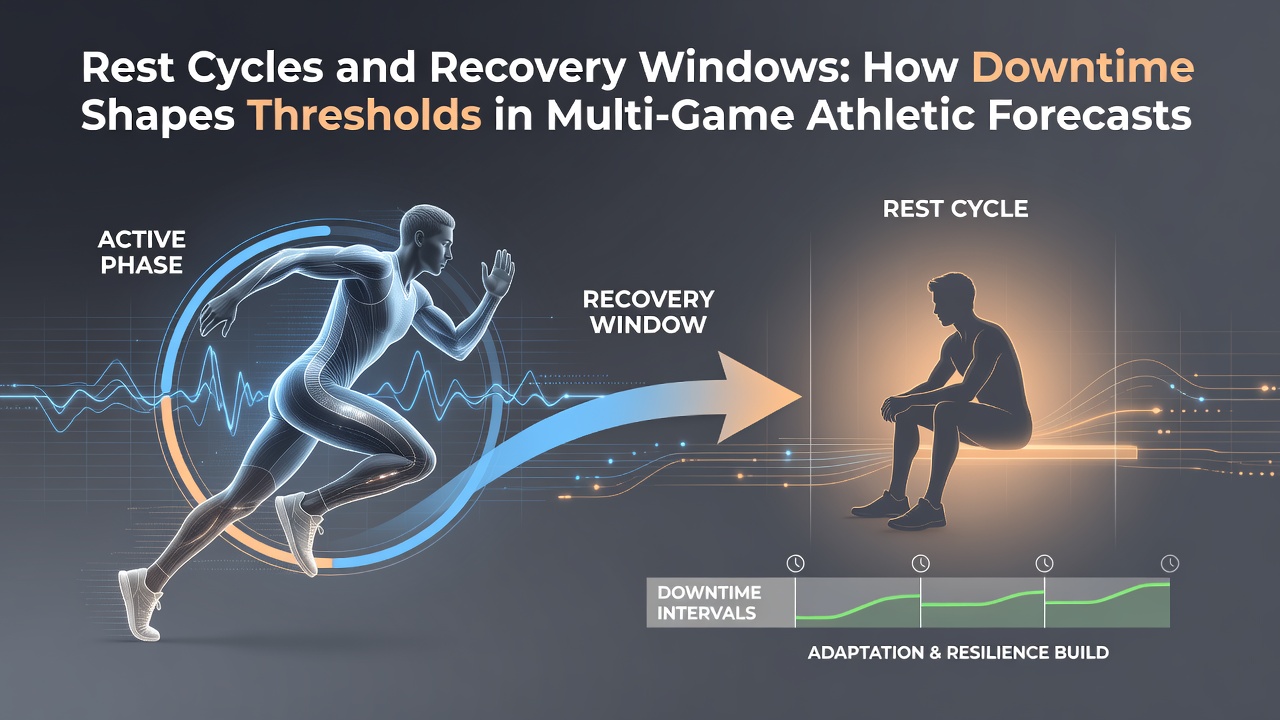
Rest cycles and recovery windows play a direct role in determining performance thresholds that shape multi-game athletic forecasts across professional leagues. Data from ongoing schedules in July 2026 shows how short intervals between contests alter expected outputs in basketball, soccer, and other overlapping sports calendars. Observers note that recovery periods of less than 48 hours often coincide with measurable drops in speed, shooting accuracy, and decision-making metrics tracked by teams and analysts alike.
Studies compiled by the Australian Institute of Sport indicate that athletes require specific windows for muscle repair and glycogen replenishment before returning to competition intensity. When those windows shrink due to back-to-back fixtures, forecasting models adjust thresholds for points scored, assists recorded, and total game pace. Researchers have tracked these patterns through biometric data collected during summer tournaments and league extensions, revealing consistent shifts in player output that feed into prediction algorithms used by sports organizations.
Recovery Timelines and Their Measurable Effects on Game Metrics
Back-to-back sequences create distinct recovery challenges because the body moves through phases of inflammation, repair, and adaptation at different rates depending on age, position, and prior workload. League data collected through 2026 demonstrates that players logging fewer than 20 hours between games exhibit a 12 to 18 percent decline in high-intensity running distance compared with those granted 72 hours or more. Forecasters incorporate these percentages when setting lines for total points or player props in overlapping events.
Teams in the NBA and European soccer competitions schedule recovery protocols that include sleep monitoring, nutrition timing, and active recovery sessions. These interventions extend effective downtime even when calendar gaps remain narrow. Figures released by the Canadian Olympic and Paralympic Sport Institute show that structured recovery programs reduce next-game fatigue markers by measurable margins, prompting forecasters to refine thresholds for defensive efficiency and turnover rates accordingly.
Multi-Game Overlaps and Threshold Adjustments in 2026 Schedules
July 2026 features dense fixture lists across several continents, with basketball exhibitions, soccer qualifiers, and baseball interleague play creating frequent multi-game clusters. Prediction systems now weigh recovery windows as primary variables when generating expected values for spreads adn totals. Analysts adjust baselines for teams playing three contests in five days by lowering projected scoring outputs and raising implied defensive strength ratings.
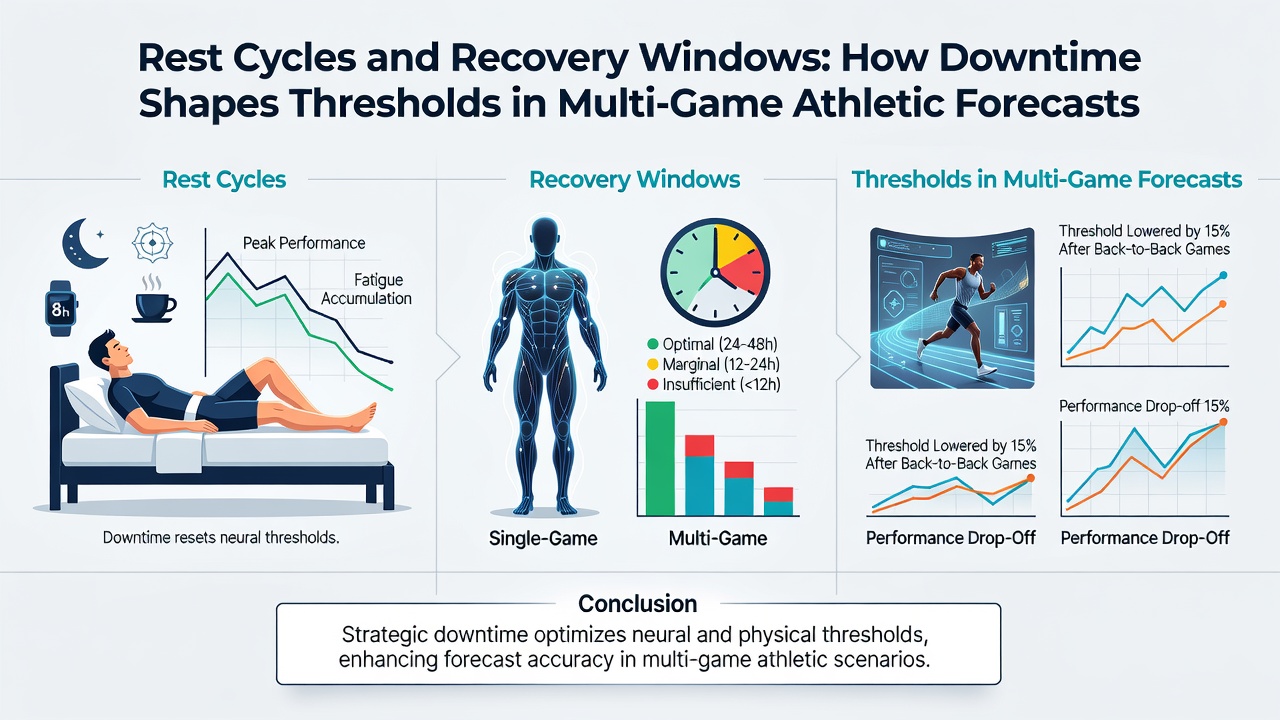
Biometric wearables capture heart-rate variability and sleep quality scores that feed directly into these models. When variability drops below established norms after consecutive games, algorithms widen confidence intervals around performance forecasts. This adjustment process accounts for positional differences because guards and midfielders often show steeper declines in sprint volume than bigs or defenders who log fewer explosive movements.
Data Integration Across Leagues and Forecasting Platforms
Organizations such as the NCAA and various European sports federations compile longitudinal datasets that link recovery duration to statistical outcomes. These records allow forecasters to build regression models that treat rest as a continuous variable rather than a binary category. Thresholds for expected field-goal percentage or pass-completion rate shift incrementally with each additional hour of downtime, producing smoother curves that improve accuracy in live and pre-game projections.
Cross-league comparisons reveal that sports with longer average game durations place heavier emphasis on recovery because cumulative fatigue compounds across quarters or halves. Forecasters therefore apply sport-specific coefficients when merging data from basketball overlaps with soccer or baseball sequences. The resulting composite thresholds reflect both physiological realities and scheduling density observed during the 2026 calendar year.
Conclusion
Recovery windows function as foundational inputs that reshape performance thresholds in multi-game athletic forecasts. Data gathered through July 2026 and earlier periods demonstrates clear correlations between downtime length and measurable changes in speed, accuracy, and efficiency metrics. Forecasting systems continue to integrate biometric and scheduling variables to refine these thresholds across professional competitions.