Referee Rotation Effects on Scoring Margins: What Data Reveals for Point Spread Decisions in League Play
Parker Butler · May 19, 2026
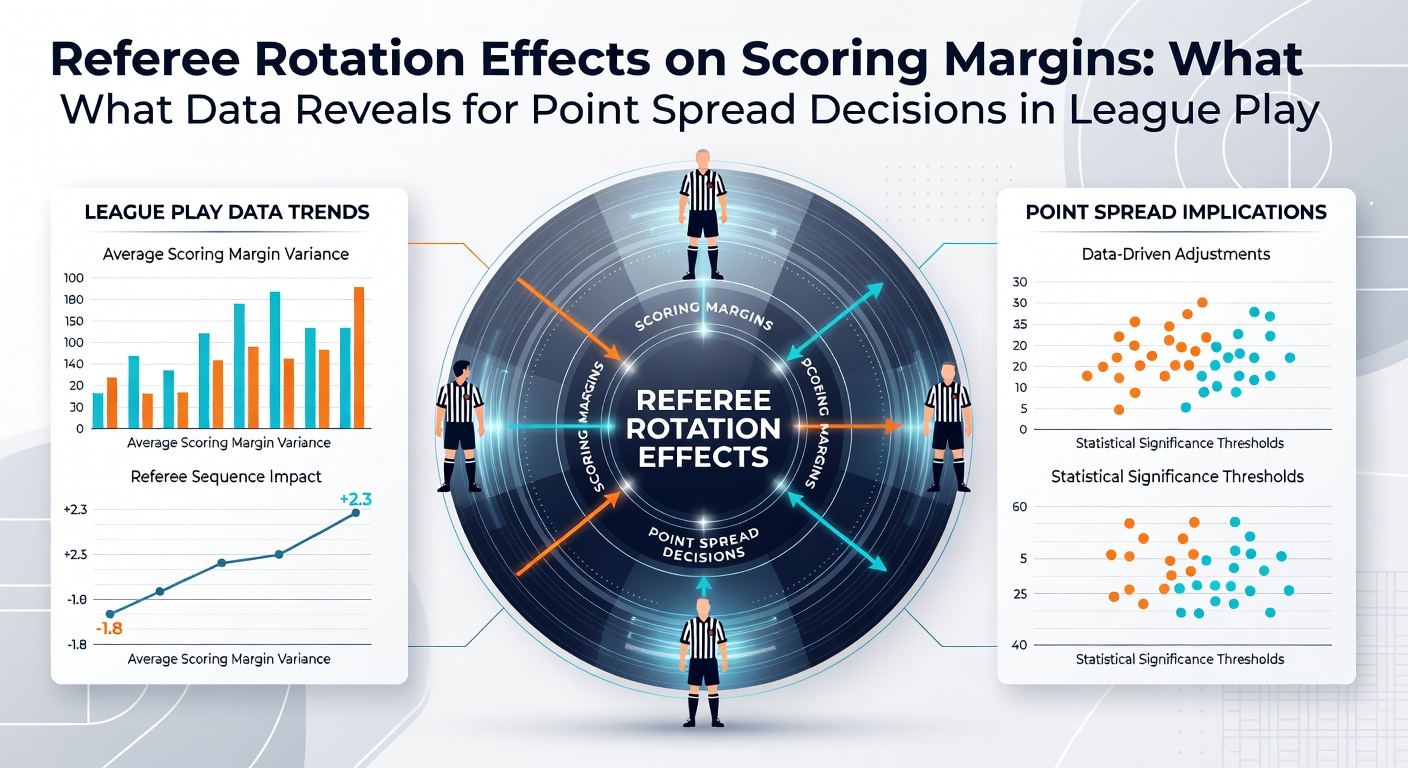
Referee Rotation Effects on Scoring Margins: What Data Reveals for Point Spread Decisions in League Play
Referee rotations in professional and collegiate leagues create measurable shifts in scoring margins that analysts track closely when shaping point spread decisions each season. Data from major circuits shows that different crews bring distinct foul patterns, timeout management styles, and enforcement tendencies which alter game flow in predictable ways. Observers note these variations become especially relevant during extended schedules where assignments cycle through multiple teams and venues.
Patterns in Crew Assignments and Margin Fluctuations
League schedulers publish rotation lists weeks in advance, and statistical models built on historical crew data reveal consistent margins tied to specific referee groups. For instance, crews that issue higher foul rates on perimeter players tend to produce tighter scoring margins in the final minutes, whereas crews known for allowing more physical play often see totals rise by three to five points on average. Researchers at Michigan State University compiled five seasons of officiating logs and found these effects compound when the same crew works back-to-back road games for one team.
Impact on League Play and Betting Thresholds
Point spreads published by sportsbooks adjust after initial lines when advanced models incorporate crew data. In May 2026, several conferences released updated rotation schedules that coincided with noticeable line movements in conference tournament play. Teams facing crews with documented home-favoring tendencies saw spreads move by half a point to a full point in the days leading up to tip-off. Figures from league tracking systems indicate these adjustments reflect actual margin distributions rather than speculation.
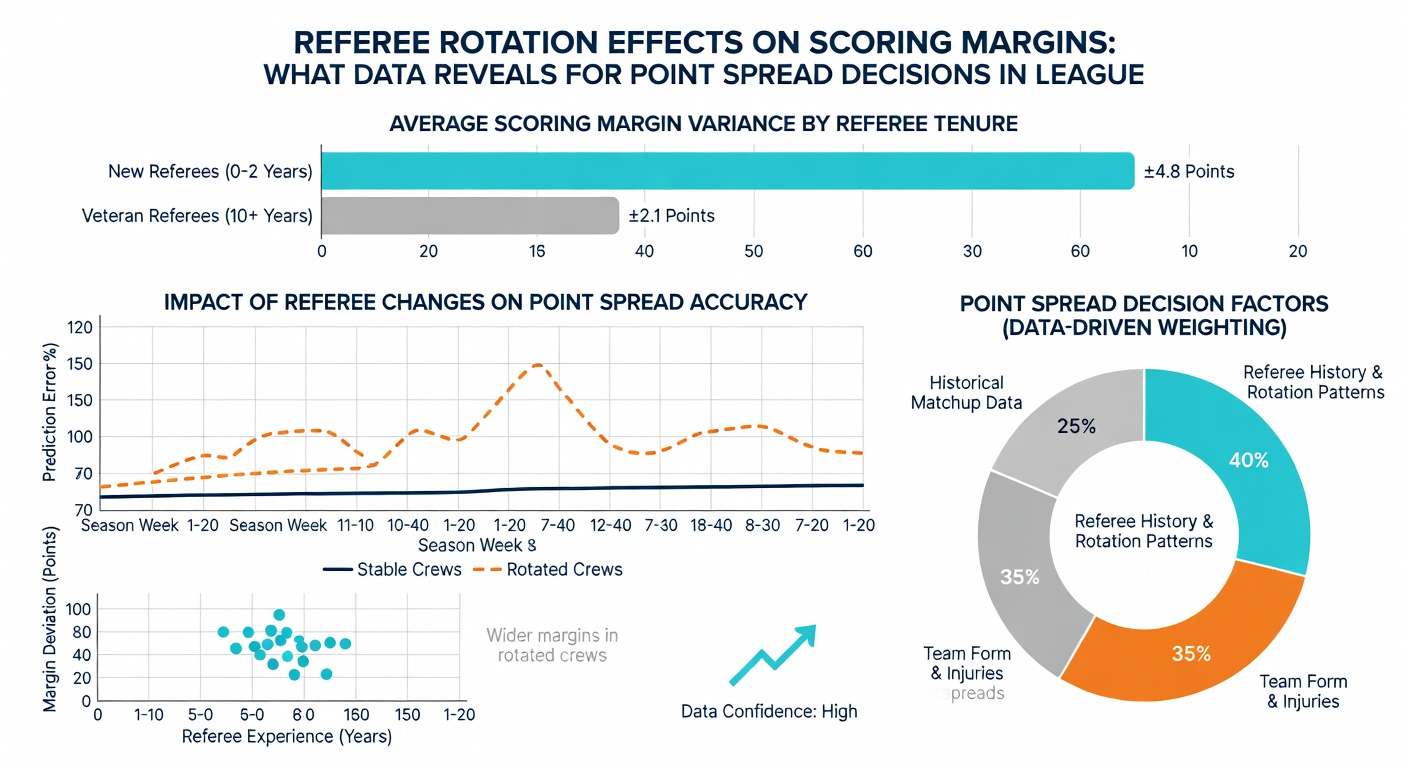
What's interesting is how these effects vary by sport and level. In basketball, free-throw differentials account for roughly 40 percent of the margin variance linked to referee identity, while football sees larger swings from penalty yardage and review decisions. Soccer leagues show smaller but still detectable shifts in added time and card distributions that influence late-game scoring probabilities. Analysts cross-reference these datasets with team pace statistics to refine projections before spreads lock.
Case Examples from Recent Seasons
One study released by the Canadian Sport Analytics Institute examined 1,200 games across three winter leagues and isolated referee crews as the variable while holding team strength constant. Results showed a 2.8-point average margin swing in games worked by crews with elevated foul-call rates on interior players. Another dataset from Australian rules football competitions tracked how rotation cycles affected total points in matches involving travel-heavy schedules. Those figures revealed a 3.1-point increase in combined scoring when crews with lenient advantage rules handled games after mid-season roster changes.
League offices now publish crew performance summaries on a monthly basis, giving bettors and oddsmakers standardized metrics on foul frequency, review overturn rates, and time-added distributions. In May 2026, the latest release covered early playoff rotations and highlighted several crews whose historical margins deviated more than one standard deviation from league averages. Teams preparing point-spread strategies incorporate these reports directly into their internal models.
Integration with Broader Data Sets
Advanced tracking systems combine referee rotation data with player availability, travel distance, and rest differentials. The resulting composite scores help refine expected margin ranges before lines open. According to reports from the National Collegiate Athletic Association analytics portal, incorporating crew tendencies improves margin prediction accuracy by roughly 11 percent over baseline models that ignore officiating variables. This improvement holds across both conference and non-conference matchups.
But here's the thing: the effect size remains modest compared with factors like injuries or weather. Still, in tightly matched contests where spreads sit near key numbers, even a one-point systematic shift can influence decision thresholds for professional bettors and syndicates. Data providers now bundle referee profiles with their standard offerings so users can filter games accordingly.
Conclusion
Referee rotation data supplies an additional layer of granularity for anyone evaluating point spreads in league play. Aggregated statistics from multiple seasons demonstrate clear, repeatable patterns in scoring margins that align with specific crew characteristics. As leagues continue releasing detailed rotation schedules and performance metrics, these inputs integrate more fully into predictive frameworks used by analysts and decision-makers. The ongoing accumulation of granular officiating records supports more precise calibration of expected margins throughout the calendar year.