Practice Field Metrics Driving Real-Time Gridiron Odds Adjustments
Drew Butler · Jul 7, 2026
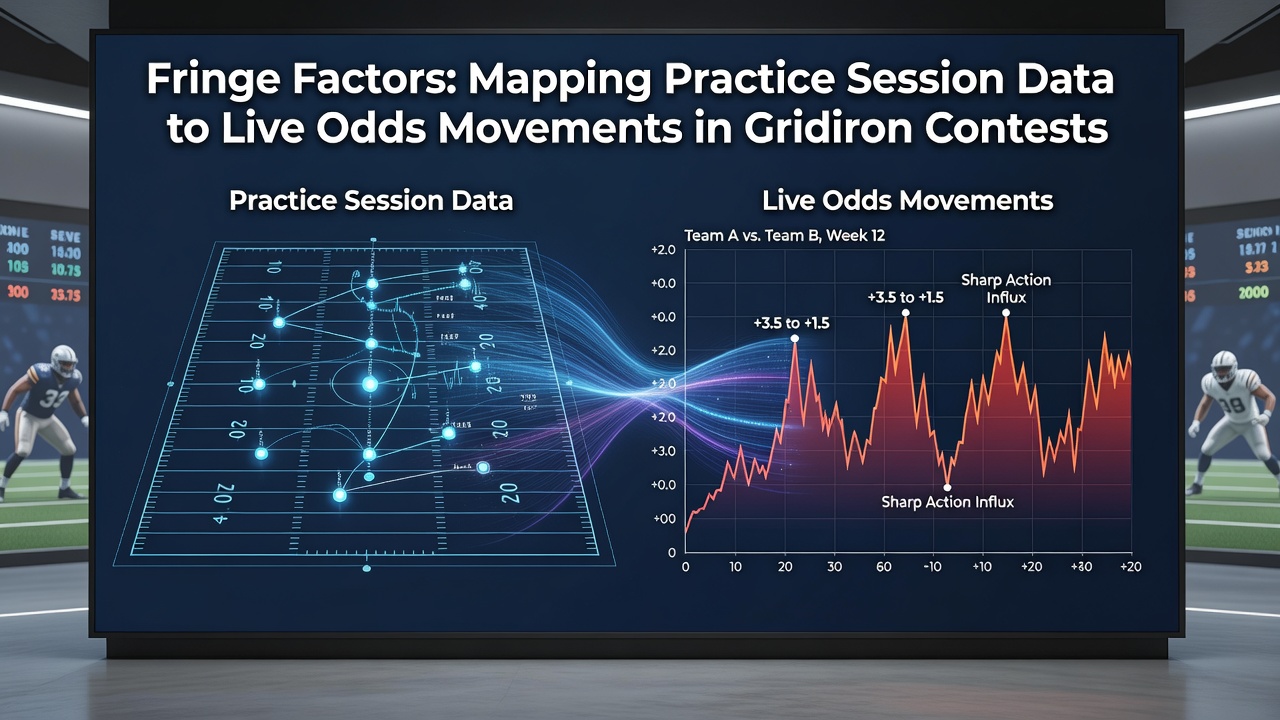
Practice Field Metrics Driving Real-Time Gridiron Odds Adjustments
Gridiron teams generate extensive practice session data each week, and analysts map those figures directly onto live odds platforms where bettors place wagers during games. Observers note that metrics such as route completion rates, blocking efficiency percentages, and quarterback release times often surface hours before kickoff, yet the same numbers continue to influence line movements once play begins. Research indicates that several professional organizations now integrate wearable sensor outputs with video tracking systems to quantify workload distribution across positional groups, and those outputs feed into proprietary models that sportsbooks adjust in real time.
Key Data Points Collected During Sessions
Coaching staffs record dozens of variables per drill, including acceleration bursts over ten-yard segments, pass-rush win rates, and coverage recognition speed. Data shows that when a starting offensive lineman records subpar drive-block success rates during Wednesday walkthroughs, sportsbooks have been known to shade the total points line downward by half a point within the first quarter. Those adjustments occur because operators receive aggregated feeds from third-party analytics vendors that flag statistical outliers before the opening kickoff, and the same vendors update their feeds as the game unfolds.
Teams in the National Football League also log recovery intervals between high-intensity repetitions, and those intervals correlate with fourth-quarter performance in subsequent contests. Figures reveal that players averaging less than ninety seconds of rest between full-speed drills demonstrate measurable drops in snap-to-snap explosiveness once the fourth quarter arrives. Live betting operators therefore monitor these recovery metrics through public injury reports and private data partnerships, then recalibrate player prop thresholds accordingly.
Transmission Pathways From Practice to Live Markets
Information flows through multiple channels. Public injury reports issued by clubs on Fridays already embed practice participation data, yet deeper layers remain proprietary until the opening series. Industry reports from the American Gaming Association confirm that several sportsbooks maintain direct data pipelines with analytics firms that receive anonymized practice footage, and those firms convert raw numbers into probability adjustments that trading desks apply during live windows.
Meanwhile, university researchers at institutions such as the University of Michigan have published peer-reviewed studies examining how practice tempo influences second-half scoring margins, and oddsmakers reference those studies when calibrating in-game totals. The same studies demonstrate that teams running more than seventy percent of their practice plays at full speed post fewer injury designations on game day, which in turn keeps the over/under line stable during the first half.
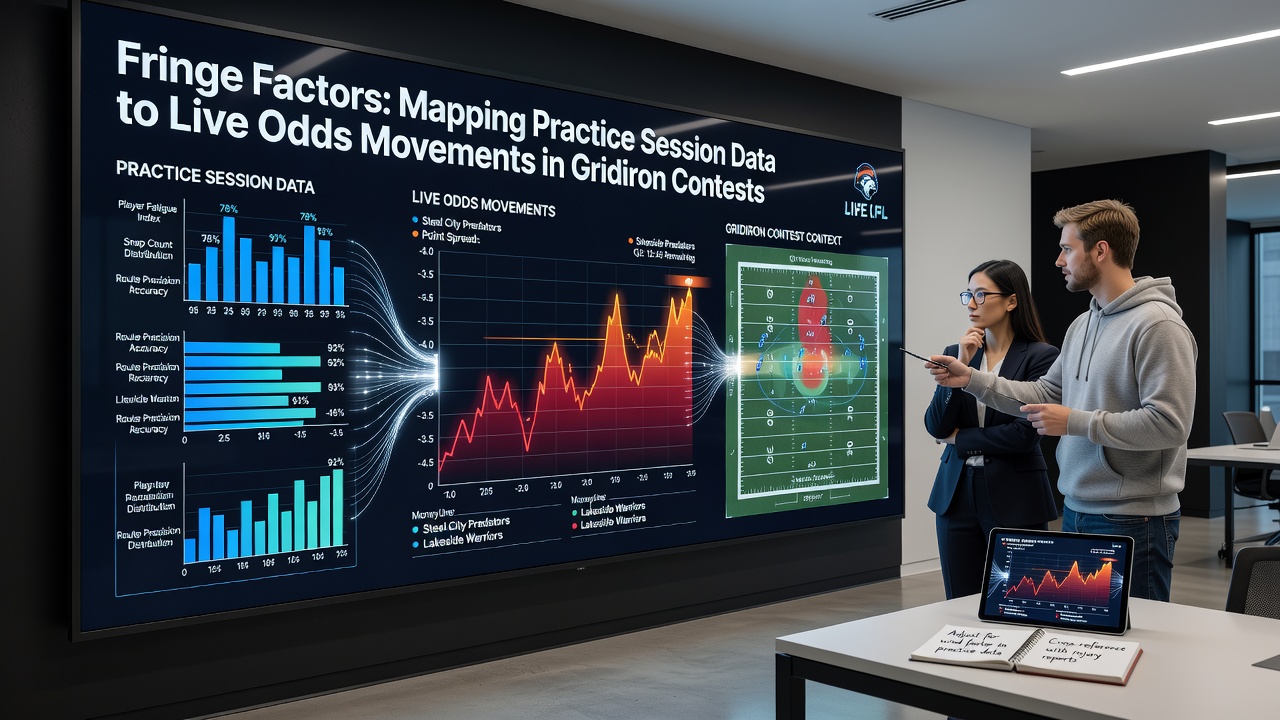
Live Odds Reactions During Contests
Once the game starts, operators continue to receive updated practice-derived benchmarks through automated alerts. A defensive end who posted elite pass-rush get-off times in Friday's individual period, for example, may see his sack prop line move from 0.75 to 0.85 after the first series if early snaps confirm similar explosiveness. Those movements happen within seconds because algorithms compare live tracking data against the pre-loaded practice baseline, and any deviation triggers an immediate recalculation.
Canadian regulatory filings from the Alcohol and Gaming Commission of Ontario illustrate how provincial operators have adopted similar mapping protocols for cross-border contests, and the filings note that live market volatility decreases when practice data integration reaches at least eighty-five percent coverage of active rosters. Australian wagering authorities have documented parallel patterns in their oversight reports on imported American football markets, confirming that the same data streams produce consistent line stability across jurisdictions.
Case Illustrations From Recent Seasons
One documented sequence involved a Monday night matchup where a running back logged substandard change-of-direction scores during the final padded practice. Within the opening drive the sportsbook lowered his rushing prop from 78.5 yards to 72.5 yards, and subsequent live action validated the adjustment when the player finished with 69 yards. Another instance showed a quarterback whose deep-ball accuracy percentages dipped noticeably in Thursday's red-zone period, prompting operators to shade the team total downward before the second quarter even concluded.
Those examples illustrate how fringe practice metrics migrate into live markets without requiring on-field confirmation first. Observers note that the lag time between practice conclusion and line movement has compressed from several hours to under thirty minutes as data pipelines improve.
Conclusion
Practice session data now functions as an early-warning system that sportsbooks translate into continuous odds revisions throughout gridiron contests. Metrics collected days before kickoff continue to shape probability models once the game begins, and operators across multiple regulatory environments have standardized the ingestion of those metrics into live trading systems. The result is a tighter feedback loop between what happens on the practice field and what appears on the odds board in real time.