Navigating the Road: How Team Travel Patterns Affect Performance Consistency in Basketball Away Games
Drew Butler · Aug 20, 2026
Navigating the Road: How Team Travel Patterns Affect Performance Consistency in Basketball Away Games
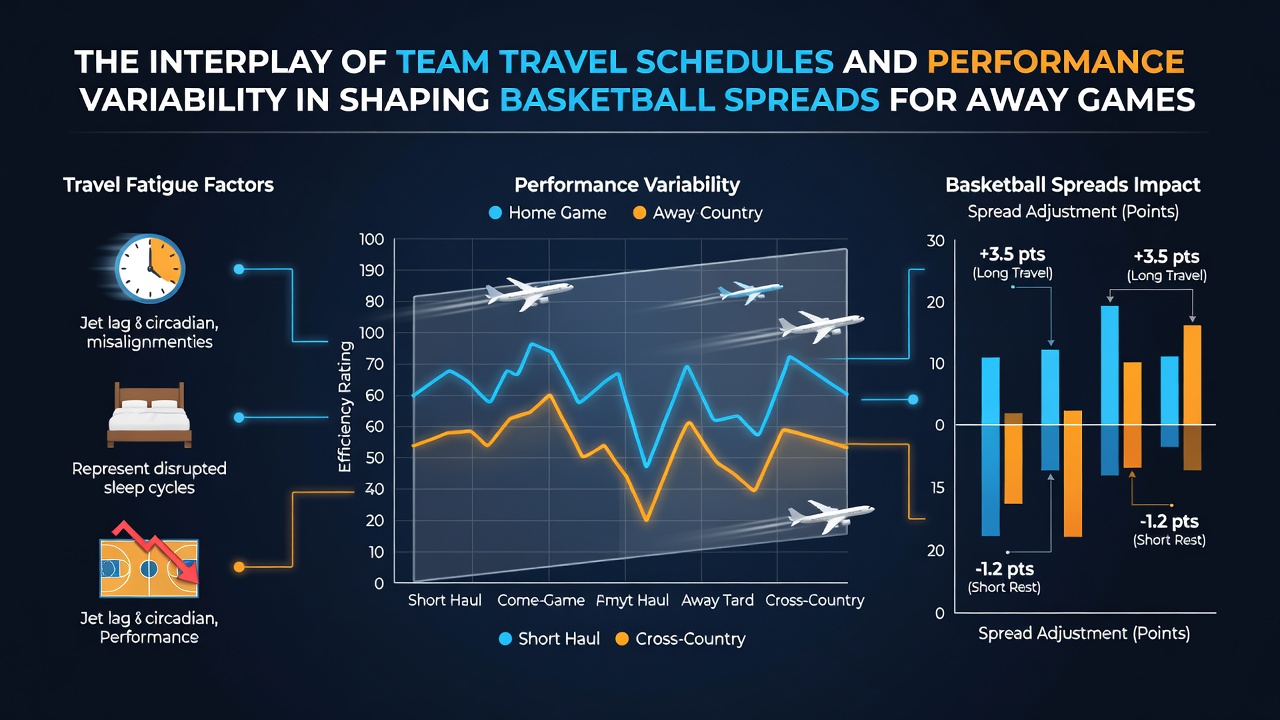
Travel schedules in professional basketball create measurable effects on player output during away contests, and these patterns feed directly into how oddsmakers construct point spreads. Teams log thousands of miles each season across varying time zones, flight durations, and recovery windows, while performance metrics such as shooting percentages, turnovers, and defensive efficiency show corresponding fluctuations that data analysts track closely. Observers note that August 2026 brought renewed attention to these variables as several franchises adjusted preseason itineraries following league-wide schedule releases.
Mapping Travel Variables Against Game Outcomes
Distance traveled, back-to-back game density, and overnight flight frequency correlate with shifts in scoring margins according to league tracking systems. Researchers at the University of British Columbia examined five seasons of game logs and identified average point reductions of 3.2 points for teams crossing two or more time zones the night before tip-off. Those figures align with spread adjustments that sportsbooks apply when setting away-team lines, particularly in Western Conference matchups involving East Coast clubs.
Performance variability appears most pronounced in the first quarter, where teams arriving via red-eye flights post lower field-goal percentages and higher foul rates. Data from the 2025-26 season shows a 7 percent increase in turnovers for squads playing their second game in as many nights after a cross-country trip. Spread setters incorporate these tendencies when establishing opening numbers, then refine them as injury reports and practice participation figures emerge closer to game day.
Seasonal Patterns and Schedule Density Effects
League schedules released each August place clusters of road games within compressed windows for certain franchises, and analysts have documented how those clusters amplify outcome variance. Teams facing three-game road swings in five days exhibit wider standard deviations in net rating compared with clubs enjoying more even home-road distribution. Bookmakers adjust spread ranges accordingly, widening lines on the second and third legs of such trips to account for elevated uncertainty.
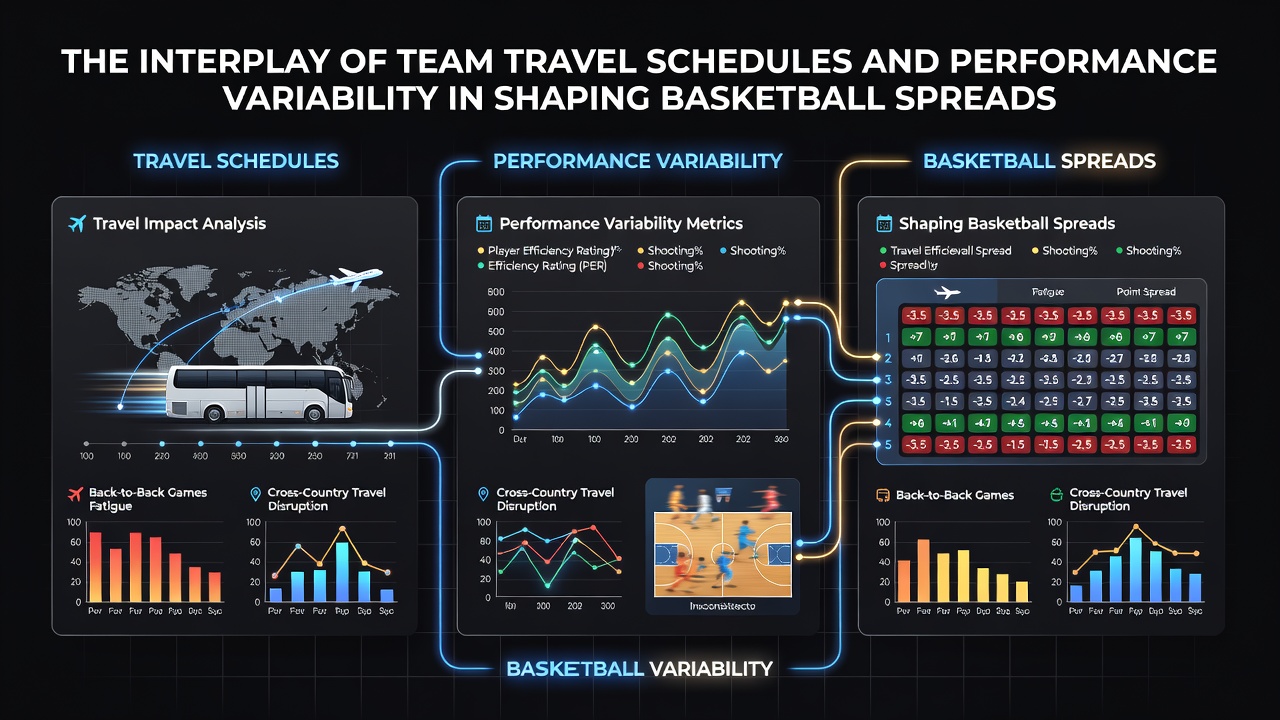
Time-zone transitions add another layer. West Coast teams traveling east often face earlier tip times relative to their internal clocks, and historical box-score aggregates reveal corresponding dips in late-game execution. Conversely, Eastern teams heading west encounter delayed circadian effects that surface in the second half. These documented patterns influence how spreads move from open to close, with sharper action frequently appearing on totals rather than sides when travel fatigue is pronounced.
Integrating Biometric and Recovery Data
Player-tracking technology now supplies granular inputs that front offices and betting markets both monitor. Sleep trackers and heart-rate variability readings collected during travel days show consistent drops that precede measurable declines in points per possession. A 2024 report issued by the Canadian Sport Institute Pacific linked a 12 percent reduction in recovery scores after flights exceeding four hours to a 4.8 point swing in average margin of victory on the subsequent road game. Oddsmakers reference similar datasets when calibrating away spreads for teams with heavy travel loads in a given week.
Coaching staffs respond with targeted recovery protocols, yet residual effects persist across game logs. Teams employing chartered flights with built-in sleep facilities post smaller performance decrements than those relying on commercial carriers, and these distinctions appear in advanced metric splits. Spread construction accounts for such operational differences when comparing otherwise comparable away matchups.
Conclusion
Travel schedules and performance variability remain intertwined factors that shape basketball spreads for away games through documented statistical relationships. League data, recovery metrics, and schedule density patterns supply the empirical foundation that oddsmakers use to set and adjust lines, while ongoing research continues to refine understanding of how distance, timing, and recovery windows translate into point differentials on the road.